First of all, the divergence ended, and second of all, the falling wedge ended as well. But if you use the divergence as only a confirmation to trade the falling wedge, then you simply wait for the price to break the 2-4 trendline before going long, because it means two things. It is risky trading bearish divergences because the market may keep forming lower lows and the RSI may keep showing a divergence. If we apply the RSI, like this, we see that the RSI is on the rise, but the price keeps falling.

If you use an oscillator, like the Relative Strength Index (RSI), and so on, it is very likely that the price will diverge from the oscillator.
RISING WEDGE TRADING SERIES
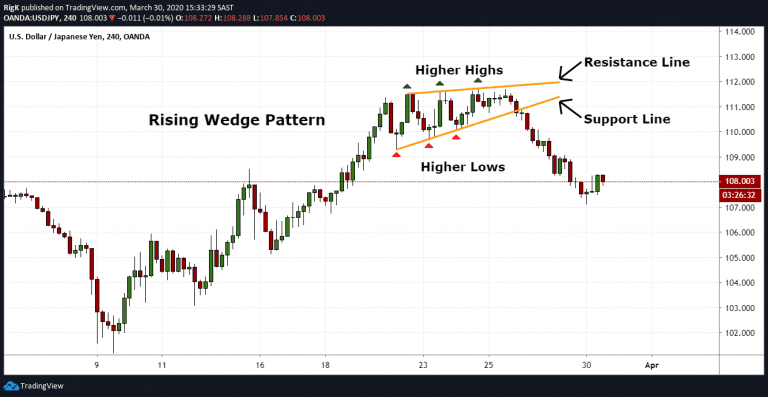
One more thing on wedges – typically when the market forms such a pattern, either at the bottom or the top of a trend, the series of lower lows or higher highs forms in a divergence with an oscillator. In this case it also retested a bit the trendline, which is something that happens often. On the two wedges, this is the trade on the long side, this is the trade on the short side.

The 100% retracement of the wedge it exceeds the wildest expectations as the market climbed higher in a bullish trend and made a new high. The 50% retracement provides for more than 1:4 or 1:5 risk-reward ratio.

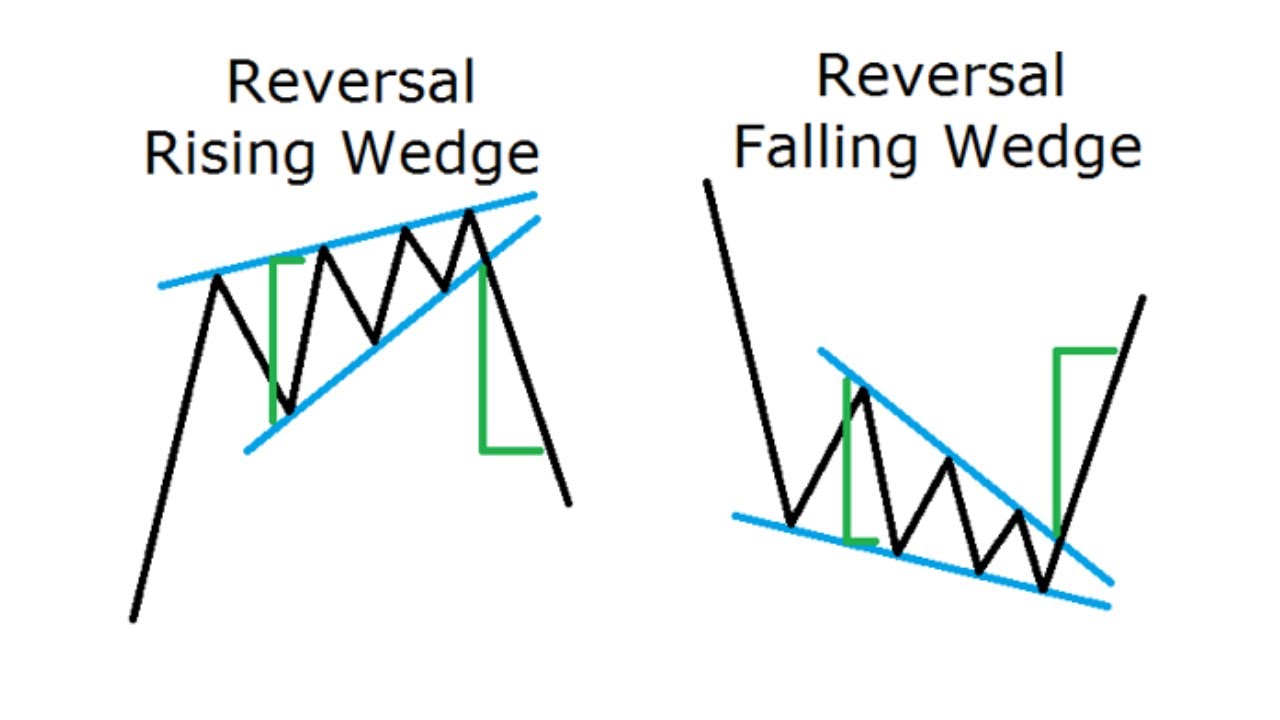
This is the risk and you can define the reward in many ways. The entry on the long side comes by the time that the price breaks the upper edge of the falling wedge and the stop-loss is mandatory to be at the lows. If we connect these one – imagine five points here – we see that the fifth segment pierces the 1-3 trendline is a good sign that you want to see. If we apply the same principles as discussed here, we see that the market, when dropping from 1.24 to 1.19, it formed a series of marginal lows and lower highs. This is an example of a rising wedge, but on this chart, we see an example of a falling wedge. They do not work in the sense that sometimes the market forms a so-called running triangle, that looks like a wedge, but in reality, after breaking the 2-4 trendline, the market fully reverses and continues aggressively in the opposite direction. Why it is mandatory to have a stop loss at the highs in a rising wedge or at the lows in a falling wedge? The answer comes from the fact that these patterns sometimes do not work. If you go for the 50% retracement, that would be more than 1:2 or 1:3 risk-reward ratio, more than enough and if you go for the 100% retracement, then money management would be even better.
RISING WEDGE TRADING HOW TO
How to trade it? Well, this is the entry price, you must put a stop loss at the highs, let’s make it of a different color, this would be the entry – this is the risk, and this is the reward. It usually reverses 50% of the entire wedge, and often 100% of the entire wedge. Then the market breaks lower and it often retests the 2-4 trendline. Very often the price action in the 5th segment pierces the 1-3 trendline – that is something you want to see in such a pattern. This is also called the 2-4 trendline if you are to label them as 1,2,3,4,5. To trade them, the ideal way is to wait for the lower edge to break. The opposite is true in the case of a falling wedge. This is called a rising wedge, and to interpret it correctly you must connect the marginal highs and the higher lows, and it looks like this. Rising and falling wedges are powerful patterns – a rising wedge is always falling, is a bearish pattern, and a falling wedge is always rising, is a bearish pattern.Ī rising wedge looks like this – the market is in a bullish trend, and then suddenly it begins forming a series of marginal highs only, before eventually reversing. These are classic technical analysis reversal patterns, as they form at the end of bullish, respectively bearish trends. Hello there, this is and this video deals with rising and falling wedges.


 0 kommentar(er)
